


Key points:
- Bitcoin risks falling below $65,000, but lower levels are likely to attract solid buying by the bulls.
- HYPE, ZEC and XLM look strong on the charts while other major altcoins risk resuming their downtrend.
Bitcoin (BTC) is attempting a bounce off the $65,426 level, but the bulls are struggling to hold onto higher levels. The launch of fresh strikes by the US and Iran has hurt sentiment, but Bitrue Research Institute research lead Andri Fauzan Adziima told Cointelegraph that the fall was more about “leveraged liquidations, heavy ETF outflows, and technical breakdowns than pure Iran news, but it amplifies the fear.”
All eyes have shifted to BTC’s yearly lows of $60,000. Veteran trader Peter Brandt said in a post on X that BTC has formed an expanding triangle, a common and reliable pattern. He projects a decline to about $56,000, but added that a move above $75,000 would invalidate this bearish view.
Crypto market data daily view. Source: TradingView
The short-term trend has turned negative, but the bulls are unlikely to give up without a fight. Buyers are expected to enter the $65,000 to $60,000 zone, but relief rallies are likely to be sold into. Volatility is likely to increase over the next few days as the bulls and bears battle for supremacy. Buyers will have to propel the price above $77,000 to signal that BTC has bottomed out in the short term.

What are the crucial support levels to watch out for in BTC and the major altcoins? Let’s analyze the charts of the top 10 cryptocurrencies to find out.
Bitcoin price prediction
BTC collapsed after breaking below the support line on Tuesday, indicating aggressive liquidation of long positions.
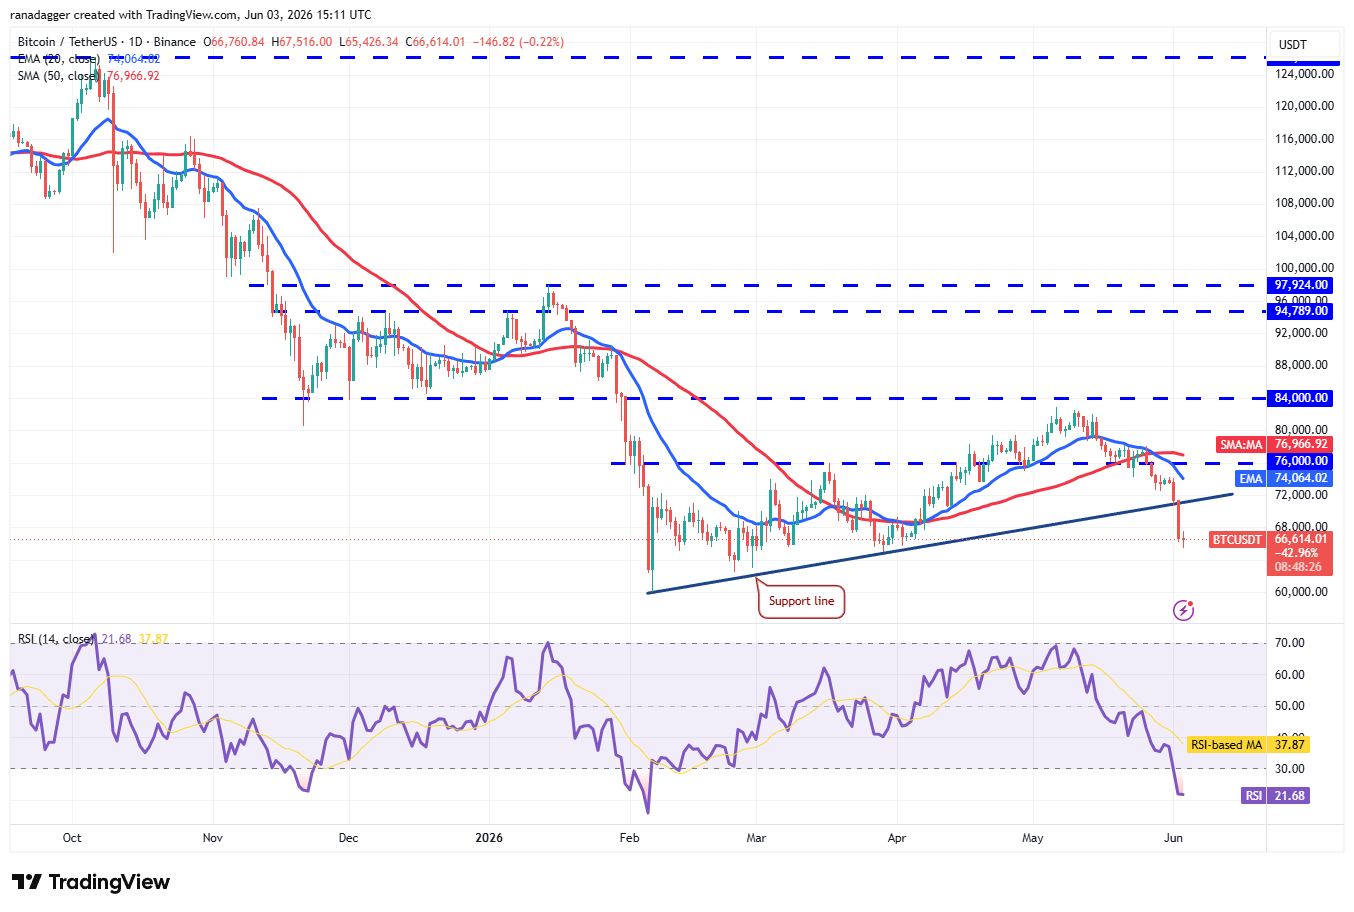
BTC/USDT daily chart. Source: Cointelegraph/TradingView
There is support at $65,000, but that may not hold. That clears the path for a drop to the $62,500 to $60,000 support zone. Buyers are expected to defend the zone with all their might, as a close below it would signal a resumption of the downtrend. The BTC/USDT pair then risks falling to $50,000.
The bears will attempt to maintain their advantage by selling the relief rallies to the 20-day exponential moving average ($74,064). Buyers will have to secure a close above the 50-day simple moving average ($76,966) to signal a comeback.
Ether price prediction
Ether’s (ETH) $1,916 to $2,465 range resolved to the downside on Tuesday, indicating that the bears are in control.
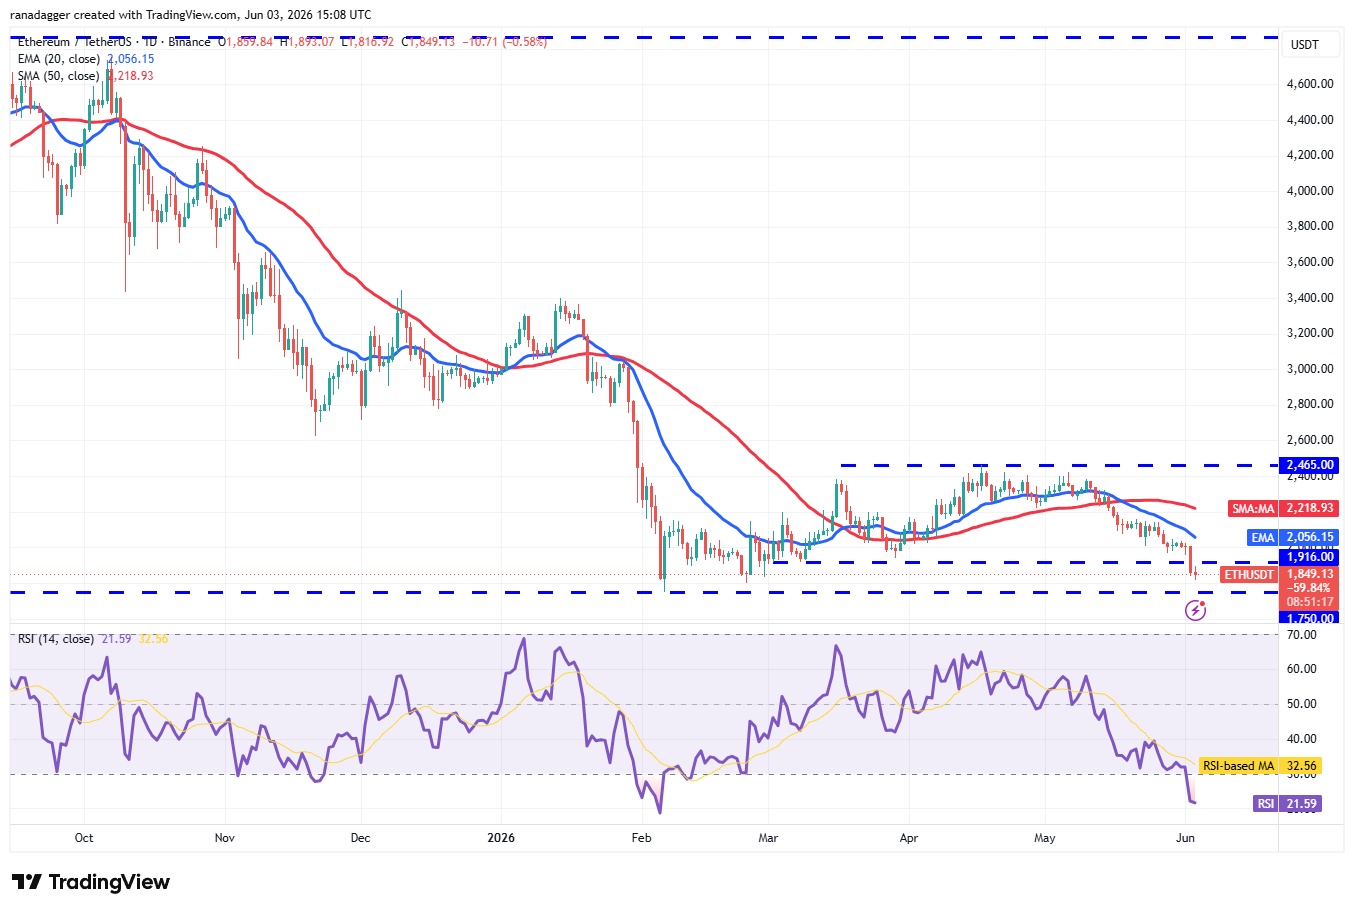
ETH/USDT daily chart. Source: Cointelegraph/TradingView
The ETH/USDT pair may dip to the solid support at $1,750. The oversold level on the relative strength index (RSI) suggests a bounce is possible from $1,750, but rallies are likely to be sold into. A shallow rebound increases the possibility of a break below the $1,750 level. If that happens, the ETH price may plummet to $1,550.
Buyers have an uphill task ahead of them. They will have to swiftly push and sustain the price above the 20-day EMA ($2,056) to suggest that selling pressure is easing. The pair may then rise to the 50-day SMA ($2,218).
BNB price prediction
BNB (BNB) fell below the breakout level of $687 on Monday and extended its decline to the 50-day SMA ($645) on Tuesday.
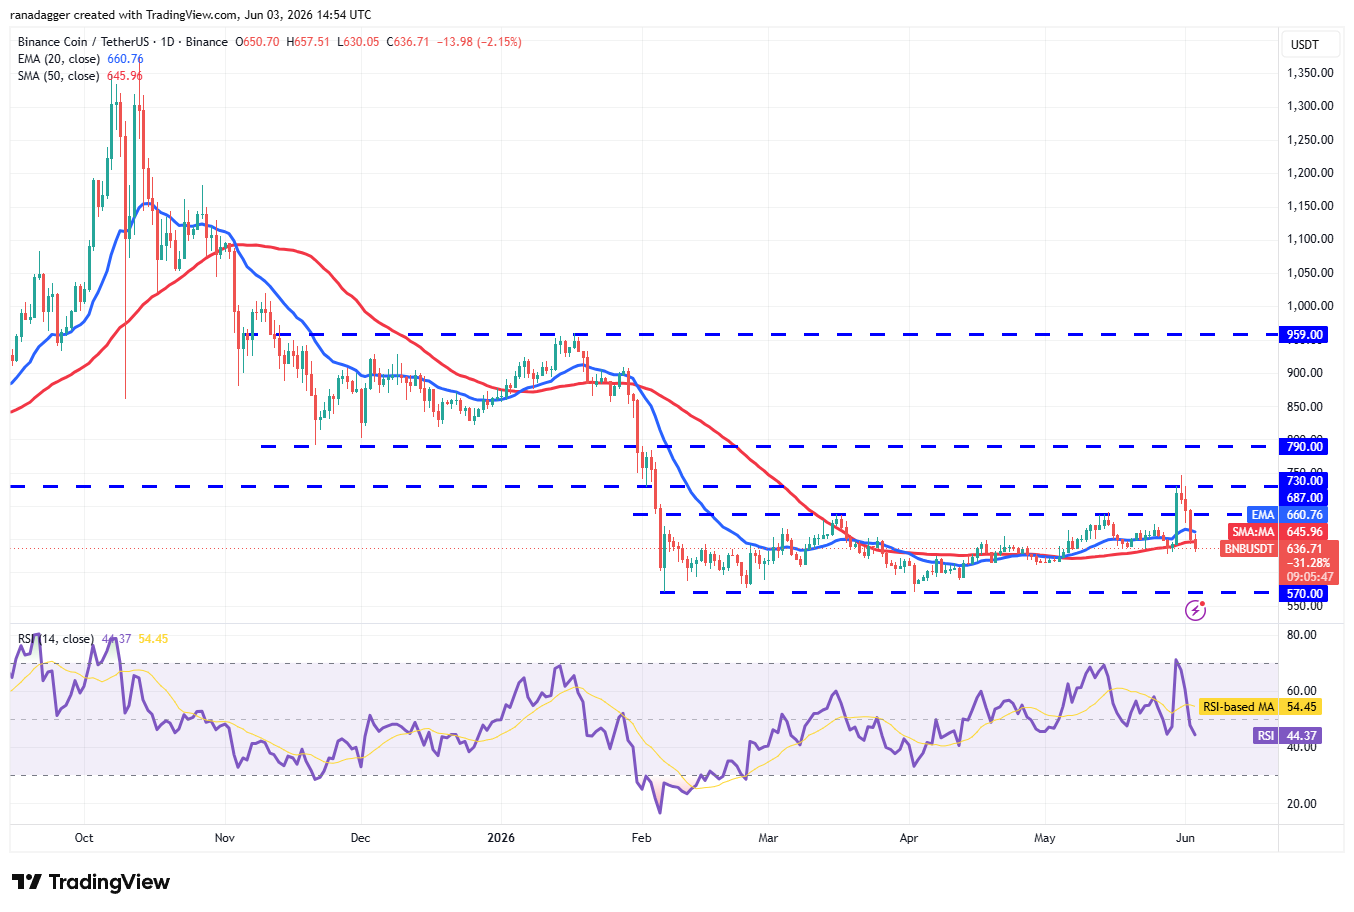
BNB/USDT daily chart. Source: Cointelegraph/TradingView
The drop back below $687 may have trapped the aggressive bulls. The $628 level may act as a temporary support, but it is likely to be broken. If that happens, the BNB/USDT pair may plummet to solid support at $570.
This negative view will be invalidated in the near term if the BNB price turns up sharply from the current level and breaks above $745. That signals solid demand at lower levels. The pair may then march to $790 and later to $900.
XRP price prediction
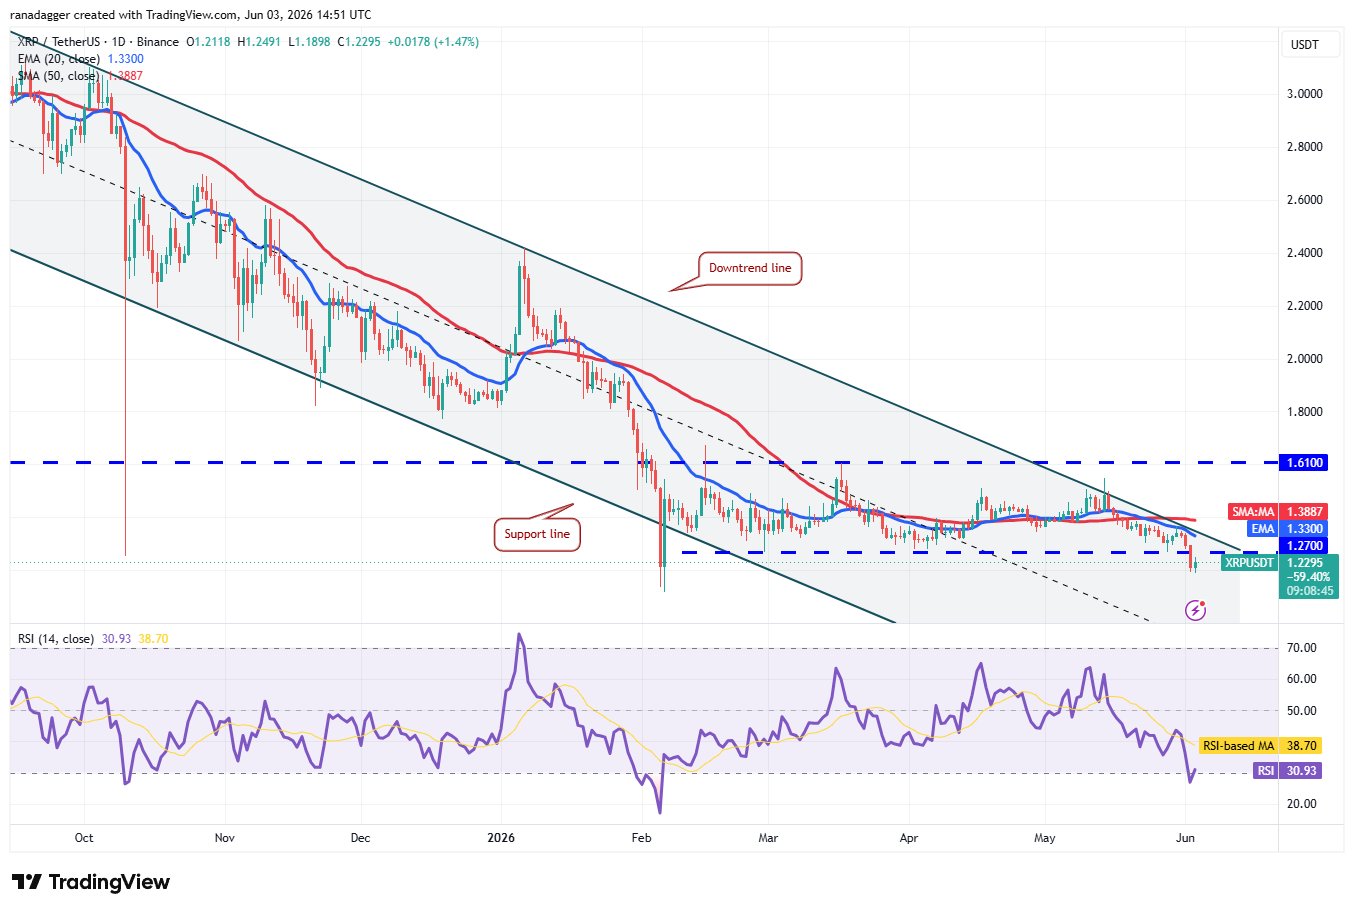
XRP (XRP) broke below the strong support of $1.27 on Tuesday, indicating that the bears are in charge.
XRP/USDT daily chart. Source: Cointelegraph/TradingView
The next support on the downside is the Feb. 6 intraday low of $1.11. Buyers are expected to fiercely defend the $1.11 level, as a close below it signals the start of the next leg of the downtrend to $1.
On the way up, the downtrend line is the first hurdle for the bulls to overcome. If they clear that, the XRP/USDT pair may climb to $1.61. Sellers are expected to pose a substantial challenge at the $1.61 level, but if the bulls prevail, a new up move may begin.
Solana price prediction
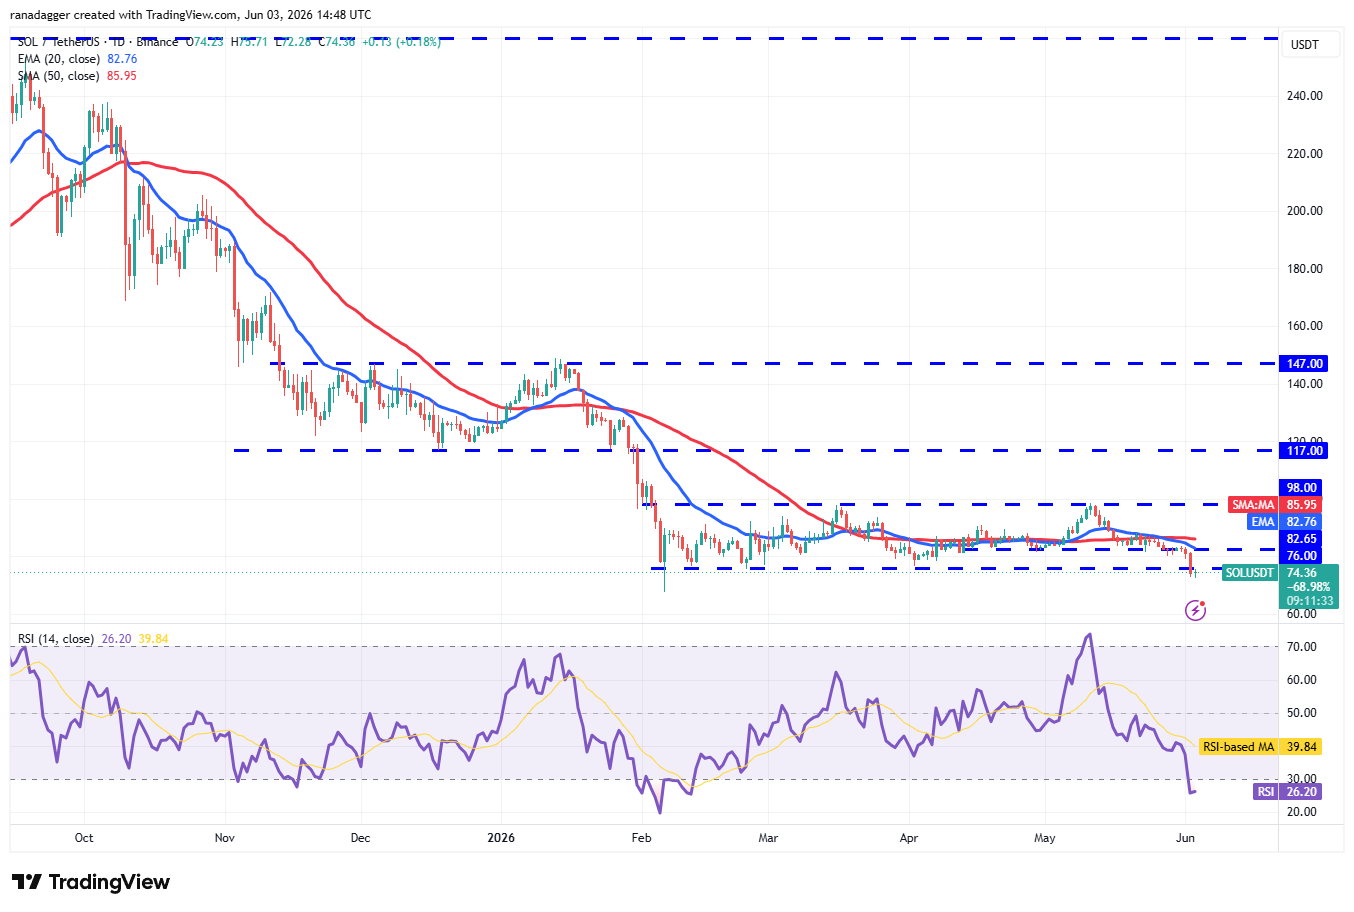
Solana (SOL) closed below the $76 support on Tuesday, indicating that the bears have overpowered the bulls.
SOL/USDT daily chart. Source: Cointelegraph/TradingView
The bulls will attempt to push the SOL price back above $76, but are expected to face significant resistance from the bears. If the price declines from $76, the next stop is likely the Feb. 6 low of $67. Buyers will strive to hold the $67 level, as a close below it may sink the SOL/USDT pair to $60.
Buyers will have to drive and maintain the price above the moving averages to suggest that the break below $76 may have been a bear trap.
Hyperliquid price prediction
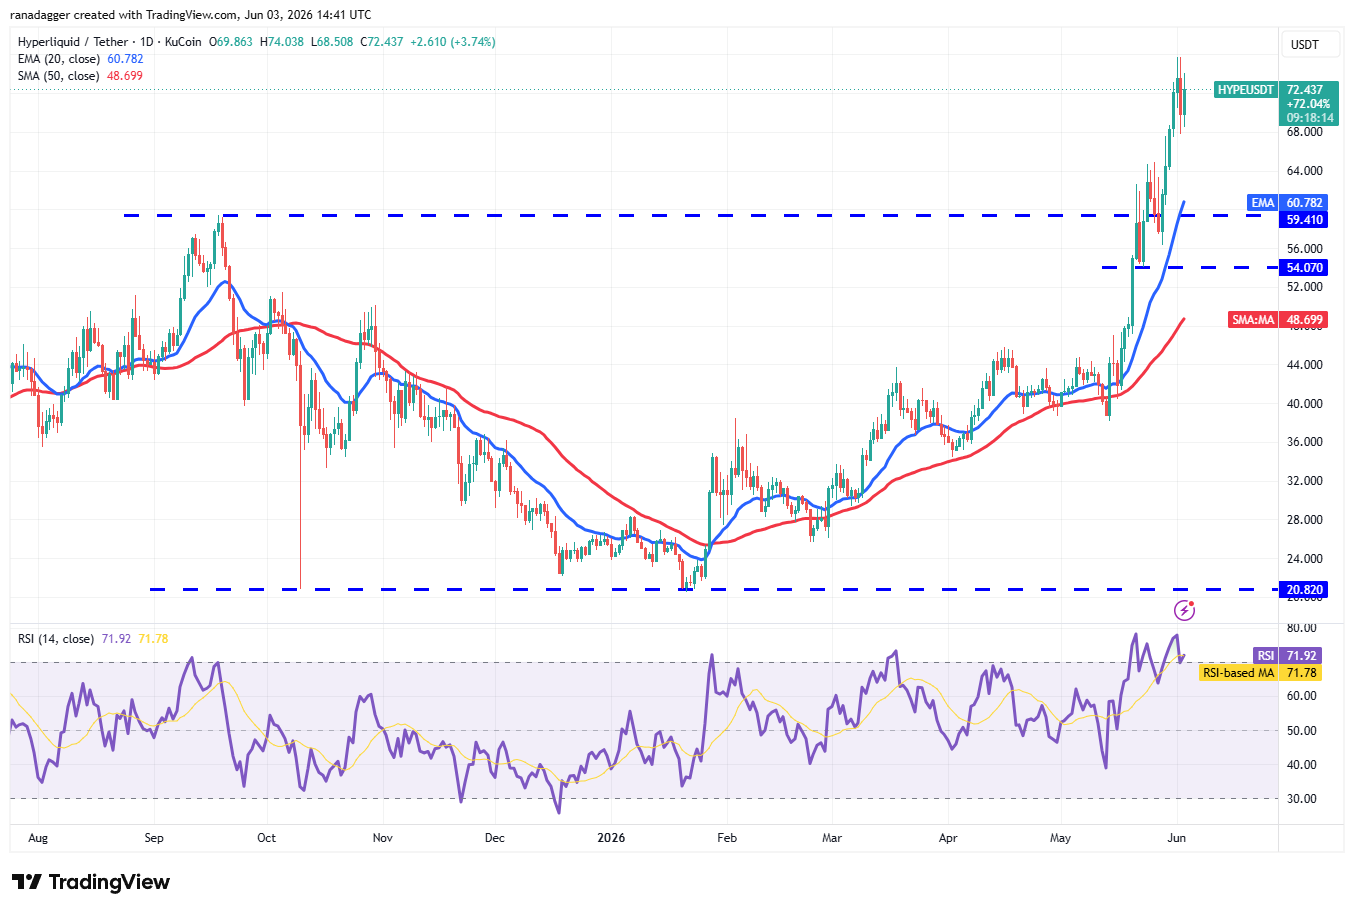
Hyperliquid (HYPE) has held strong among all the mayhem, signaling that the bulls expect the uptrend to continue.
HYPE/USDT daily chart. Source: Cointelegraph/TradingView
Profit-booking was seen near $75, but the shallow pullback suggests the bulls view the dips as buying opportunities. If buyers push the HYPE price above $75, the rally could reach the $85-$89 zone.
The first support on the downside is $64, and then the breakout level of $59.41. If the HYPE/USDT pair rebounds off $59.41, it suggests that the bulls have flipped the level into support. The buyers will then again attempt to resume the uptrend.
Dogecoin price prediction
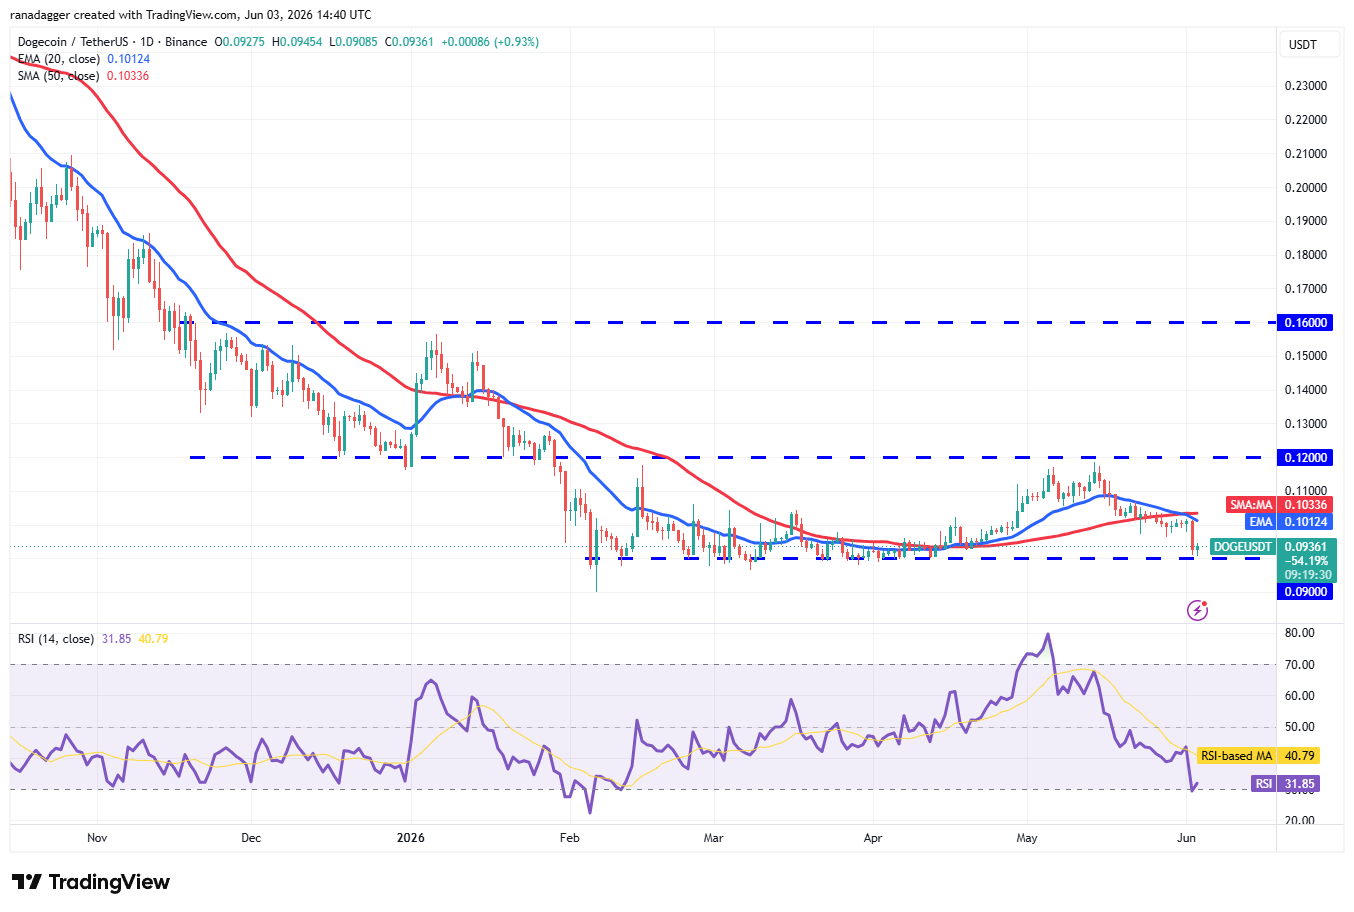
Dogecoin (DOGE) has dipped to the support of the $0.09 to $0.12 range, where buyers are expected to step in.
DOGE/USDT daily chart. Source: Cointelegraph/TradingView
If the DOGE price turns up from the current level, the bears will attempt to halt the recovery at the 20-day EMA ($0.10). If the price turns down sharply from the 20-day EMA, the risk of a break below $0.09 increases. The DOGE/USDT pair may then slump to $0.08.
This negative view will be invalidated in the near term if the price rises above the moving averages. That suggests the pair may extend its stay inside the range for a few more days.
Related: Bitcoin copying 2022 ‘almost perfectly’ as trader sees key support failing
Zcash price prediction
Zcash (ZEC) turned up and closed above the 20-day EMA ($568) on Tuesday, indicating buying at lower levels.
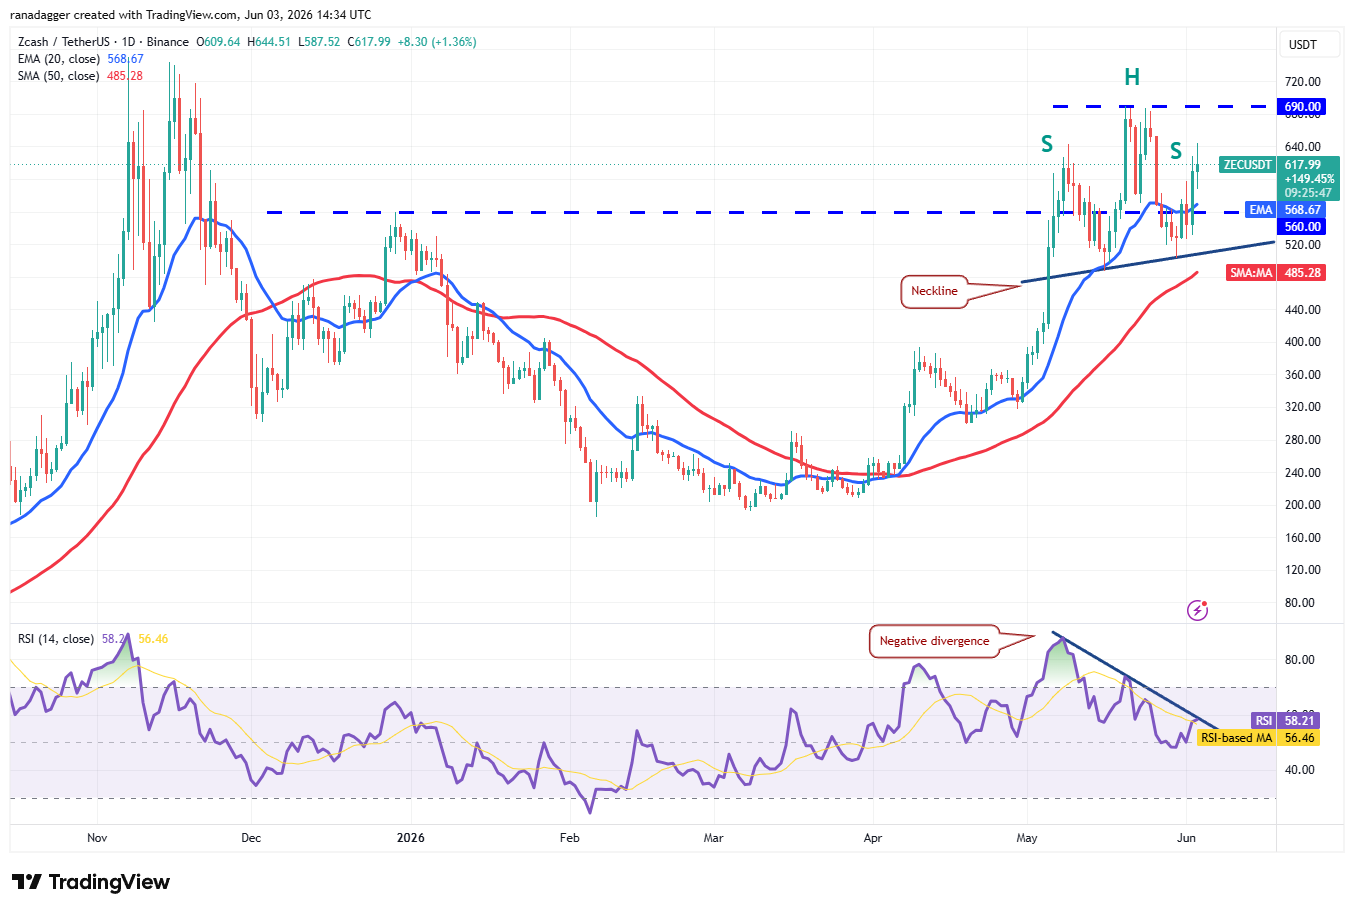
ZEC/USDT daily chart. Source: Cointelegraph/TradingView
The bulls will have to drive and maintain the ZEC price above $690 to signal the resumption of the uptrend. If they manage to do that, the ZEC/USDT pair may rally to $750, where the bears are expected to mount a strong defense. However, if buyers overcome the barrier, the pair may soar to $856.
Sellers are likely to have other plans. They will attempt to pull the price below the neckline of the developing head-and-shoulders pattern. A close below the neckline signals that the pair may have topped out in the short term.
Cardano price prediction
Cardano (ADA) continued lower, plunging below the $0.22 support on Tuesday, signaling the resumption of the downtrend.
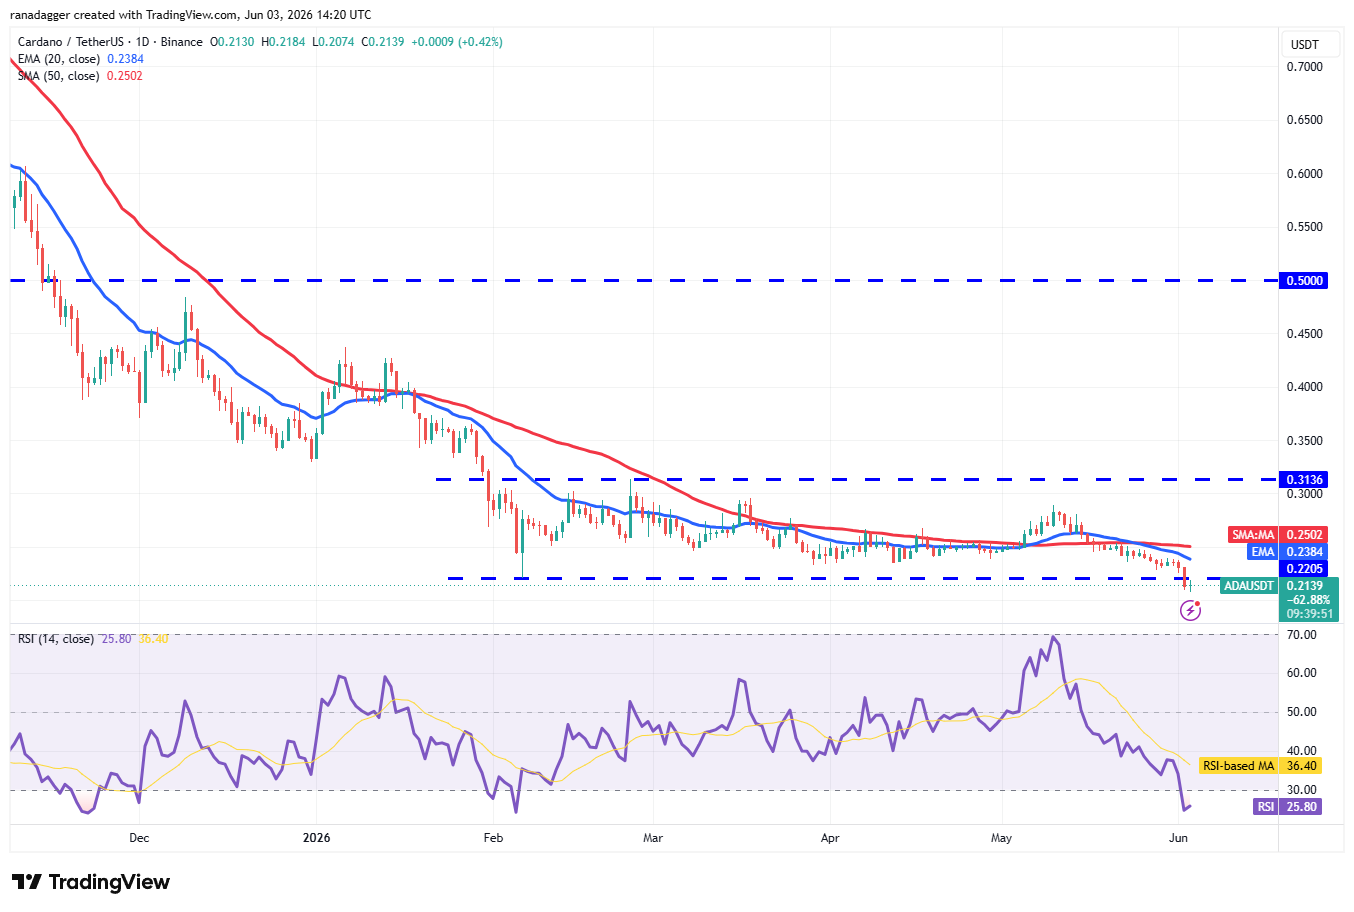
ADA/USDT daily chart. Source: Cointelegraph/TradingView
The RSI has slipped into oversold territory, increasing the likelihood of consolidation or a relief rally in the near term. Any recovery attempt is expected to face selling at $0.22 and then at the 20-day EMA ($0.24). If the ADA price breaks down from the overhead resistance, the bears will attempt to pull the ADA/USDT pair down to $0.20.
Buyers will be back in the driver’s seat on a close above the 50-day SMA ($0.25). That suggests the market rejected the break below $0.22.
Stellar price prediction
Stellar (XLM) has been in a bull phase of its own, rising from $0.14 on May 23 to $0.30 on May 30.
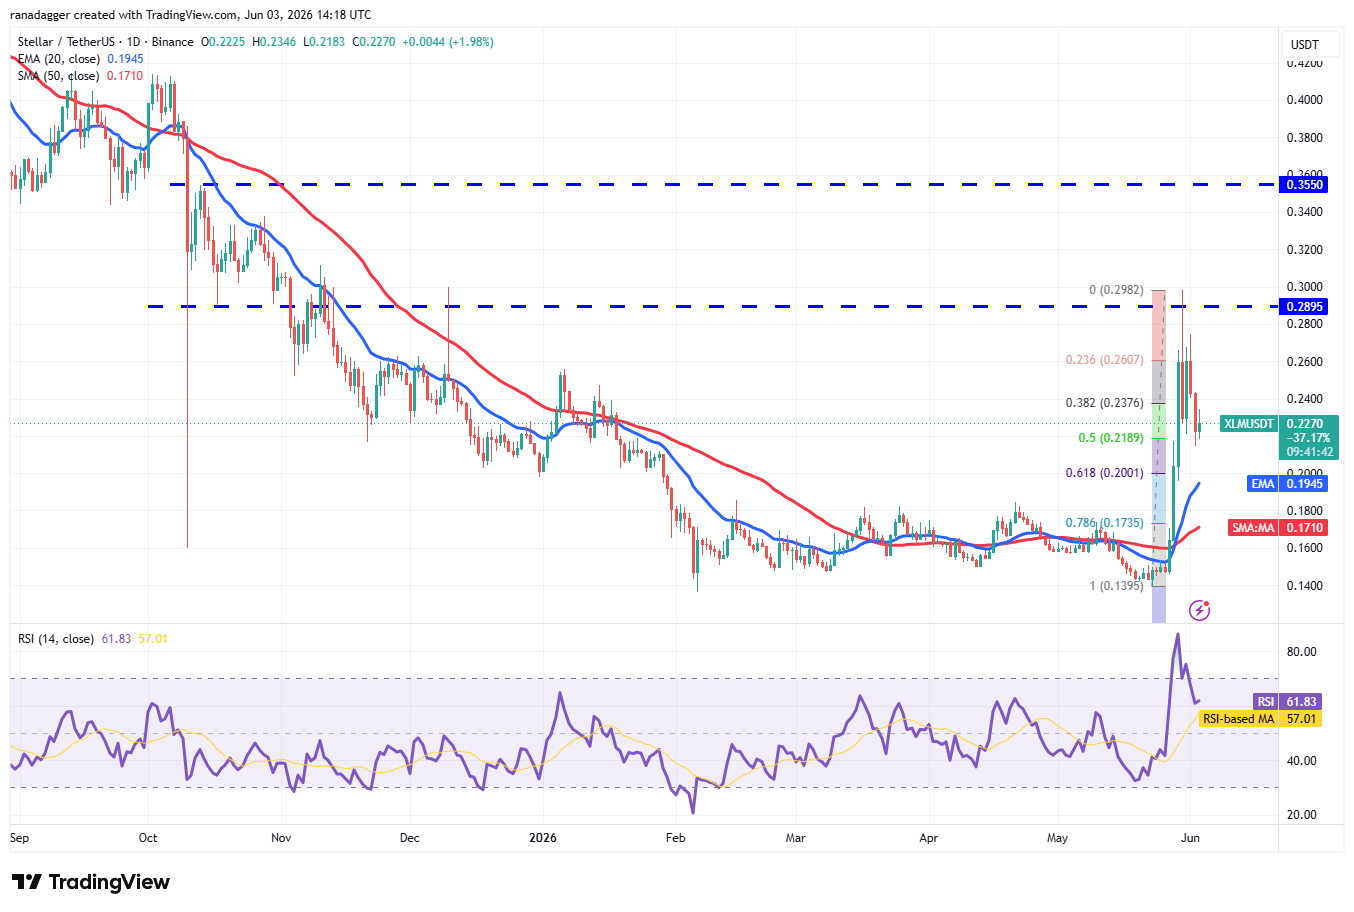
XLM/USDT daily chart. Source: Cointelegraph/TradingView
The sharp rally prompted profit-booking by short-term traders, pulling the XLM price down to the 50% Fibonacci retracement level at $0.22. If the price rises from the current level, the bulls will attempt to push the XLM/USDT pair above $0.27 and then $0.30. If they succeed, the pair may surge to $0.35.
Contrary to this assumption, if the price declines and breaks below the 61.8% retracement level at $0.20, it suggests the pair may have topped out in the near term.