


Most traders are watching Dogecoin on the daily or weekly chart, reacting to intraday price action. However, the monthly candlestick chart tells a different story, one that has been developing since the 2021 cycle and is now approaching an inflection point.
Technical analysis shows a massive bullish pennant is forming on the DOGE/USD monthly timeframe. Dogecoin is now at a lower high support in the pennant, and the technical implications are significant.

Giant Pennant Has Been Forming Since The 2021 Rally
The monthly chart shows Dogecoin’s price compressing between two converging trendlines, forming what appears to be a large bullish pennant. The structure begins with the flagpole: the near-vertical surge that launched Dogecoin from below $0.01 to its all-time high of $0.73 in May 2021.
Since that peak, DOGE’s price action has been forming a symmetrical triangle on the monthly chart, a series of lower highs and higher lows converging steadily toward an apex. The upper boundary slopes downward from the peak reached during the 2021 surge, creating a descending resistance line that has rejected several major rallies since then.
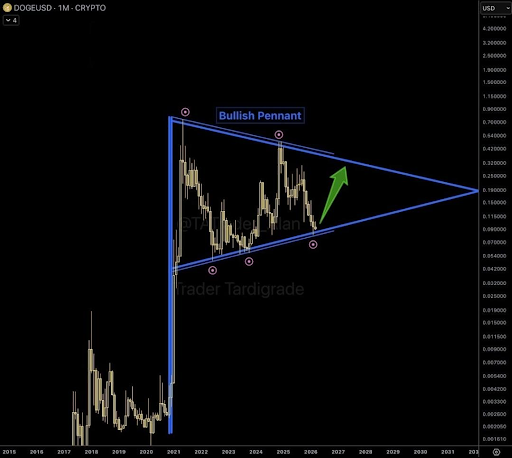
The lower boundary, on the other hand, rises gradually from the base that formed once the previous rally cooled to create a higher low. The lower trendline has provided consistent support, and critically, it held last month when the price tested the $0.08 zone.
As shown in the Dogecoin monthly candlestick chart below, these two lines have created a triangular formation that has continued to narrow since 2021. Multiple turning points on the chart show price reacting precisely at these boundaries, and the structure has been respected repeatedly over time.
Here’s What To Expect From The Bullish Pennant
One of the most important details in the chart is the most recent interaction with the lower trendline. Dogecoin dipped to the rising support boundary in February and bounced. That rebound occurred around the same area where Dogecoin has been trading recently, just below the $0.09 level.
At the time of writing, Dogecoin is trading at $0.094, still close to the support. Holding this support and closing above it in March is important for the structure because a bullish pennant depends on price remaining inside the converging boundaries. If DOGE were to close the month below the lower trendline, then the bullish outlook would weaken.
On the other hand, the bullish outlook depends on Dogecoin breaking above the upper end of the bullish pennant. The measured move target of a bullish pennant is calculated from the height of the flagpole, projected from the breakout point. Given the scale of Dogecoin’s 2021 flagpole, even conservative projections point well above $1, with upper-range targets in the $3 to $4 territory.
However, there is still much work to do for DOGE to return to the upper trendline before a breakout. Particularly, Dogecoin needs to push above $0.32 and close consecutive months above this level.
Featured image from Pixabay, chart from Tradingview.com

Editorial Process for bitcoinist is centered on delivering thoroughly researched, accurate, and unbiased content. We uphold strict sourcing standards, and each page undergoes diligent review by our team of top technology experts and seasoned editors. This process ensures the integrity, relevance, and value of our content for our readers.