



Bitcoin (BTC) circled $78,000 on Saturday after geopolitical headwinds erased most of its May gains.
Key points:
- Bitcoin falls below $78,000 for the first time since the start of May.
- Oil-supply woes combine with existing nerves over US bond markets, adding to headwinds for risk assets.
- Support weakness has traders looking at $75,000 and under next, while optimists see a “bear trap” forming.
Multiple hurdles “coming together” for crypto, risk assets
Data from TradingView confirmed new lows of $77,614 on the day — the lowest levels since May 1.
BTC/USD one-hour chart. Source: Cointelegraph/TradingView

Downside pressure stemming from concerns over US government bonds continued, with the US-Iran war also at the forefront of traders’ minds.
Iran appeared to be pressing ahead with a toll system for transit through the Strait of Hormuz — the epicenter of a global oil-supply squeeze — while keeping US traffic out.
As reported by trading resource The Kobeissi Letter among others, Hormuz would reportedly “remain closed to the operators of Project Freedom.”
On Friday, analysis from Mosaic Asset Company spelled out the problems of the current geopolitical and macroeconomic climate for risk assets.
“The prospect for another inflation wave is lining up with similarities to the surge in price levels into mid-2022,” it wrote in its latest Mosaic Chart Alerts blog post.
“Disrupted supply chains from last year’s trade war, impact of war on energy markets, and stimulus via large federal budget deficits are coming together at the same time.”
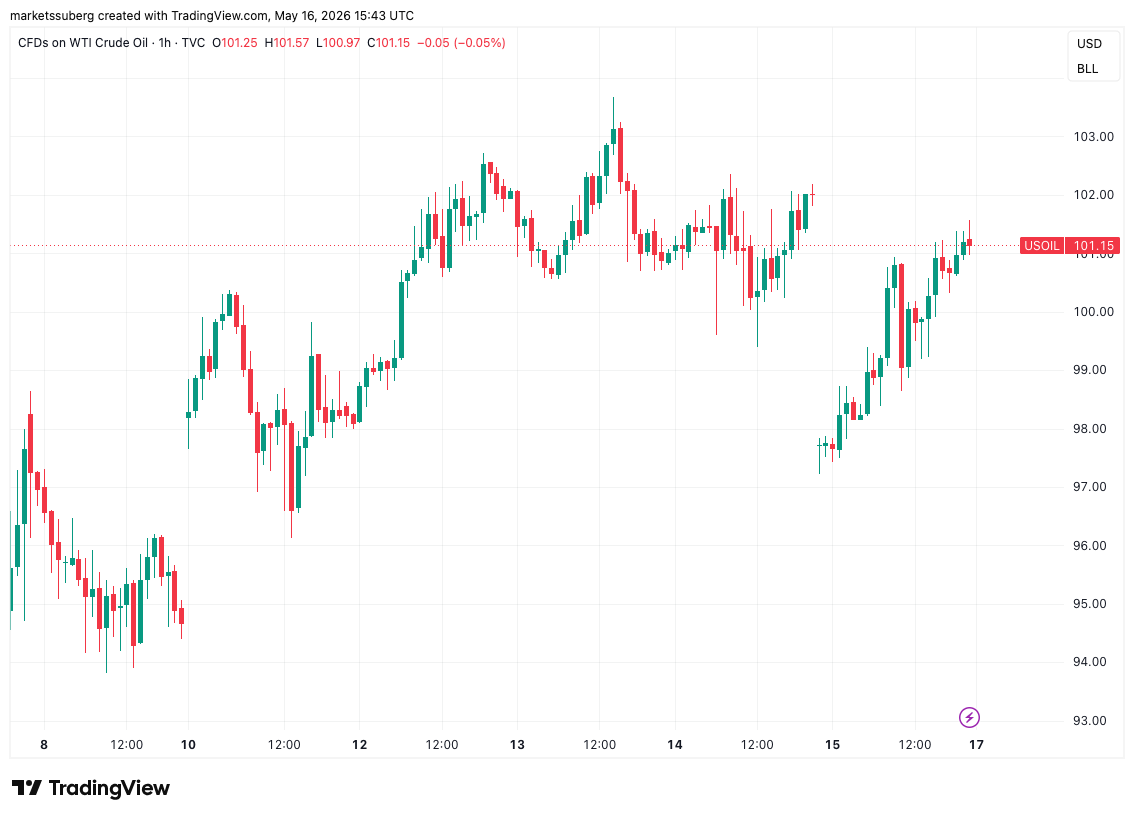
CFDs on US WTI crude oil one-hour chart. Source: Cointelegraph/TradingView
WTI crude oil finished the week trading above $100 per barrel.
Bitcoin price action teases “bear trap”
Among Bitcoin traders, there were ongoing mixed feelings about the bears’ strength below $80,000.
Related: Bitcoin price history suggests 77% odds of new all-time high within a year
“Over the last couple of days, the price has been going down slightly, while the open interest has climbed up. But things become interesting if we correlate this with Funding Rates, which have flipped negative,” X trading account Cryptic Trades wrote on X.
“This shows us that bears are DOUBLING DOWN right now and betting on a breakdown. It also shows that even though the market structure remains intact, bears are shorting as if a breakdown already happened. That’s generally how bear-traps are formed.”
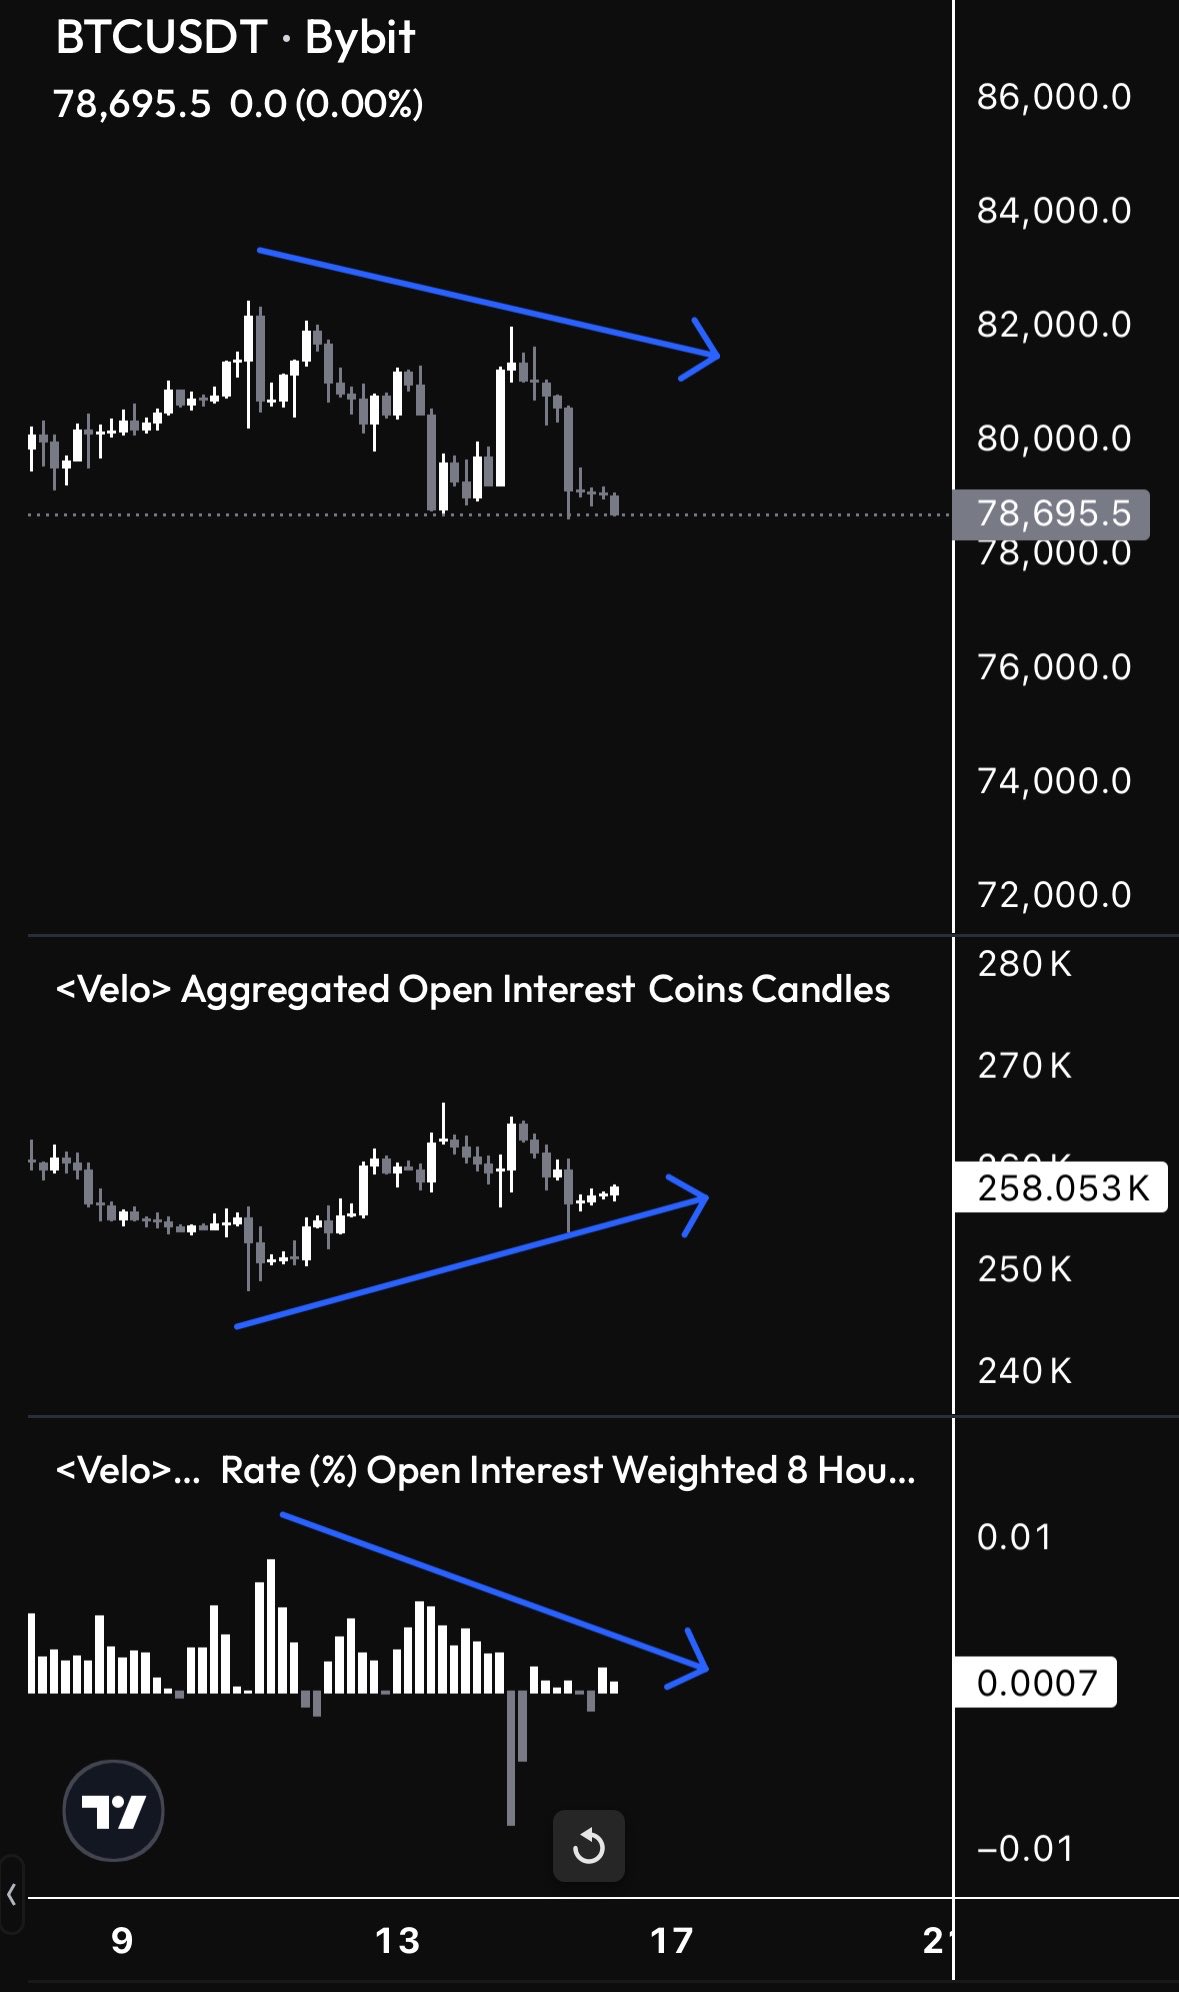
BTC/USDT chart with open interest, funding rate data. Source: Cryptic Trades/X
For analyst Eric Coleman, a target for new local lows lay at around $75,000.
“BTC went down after the breakdown retest of the ascending triangle,” he summarized alongside a chart showing relevant support/resistance flip levels.
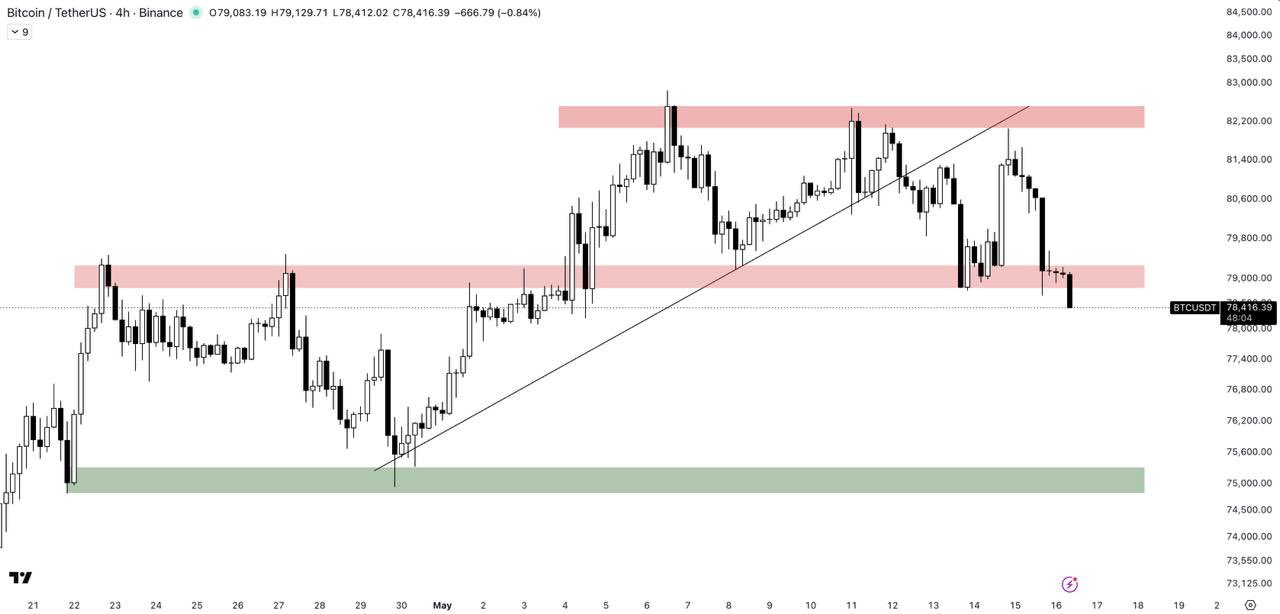
BTC/USDT four-hour chart. Source: Eric Coleman/X
Examining exchange order-book liquidity, Daan Crypto Trades highlighted $71,000 as the nearest zone of interest below price.
“The longer price compresses around this $80K region, the more liquidity will be building up on both sides which should result in a larger more aggressive move at some point,” he told X followers.
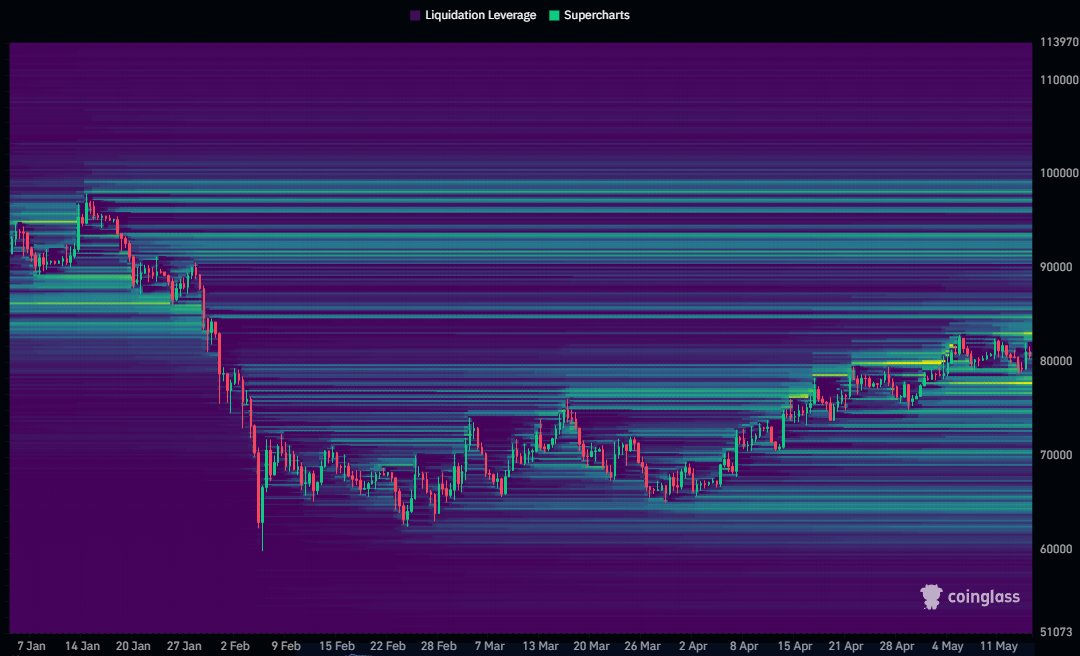
BTC/USDT liquidation heatmap. Source: Daan Crypto Trades/X