



Bitcoin (BTC) struggled to reclaim $60,000 on Friday amid continued global market volatility.
Key points:
- Bitcoin closes below $60,000 on daily time frames for the first time since September 2024.
- Asian stock markets see another day of major losses on tech-stock concerns.
- BTC price analysis hopes for a reclaim of the 200-week trend line as the bull case.
Bitcoin risks $60,000 resistance flip as tech selling persists
Data from TradingView showed that prior support was increasingly becoming the bulls’ new hurdle after Bitcoin’s first sub-$60,000 daily close since September 2024.
BTC/USD one-hour chart. Source: Cointelegraph/TradingView

Asia stock markets saw more downside on the day, with South Korean circuit-breakers kicking in on a new 8% crash.
Like on Tuesday, US stocks managed to avoid contagion, with the S&P 500 and the Dow Jones in the green at the time of writing.
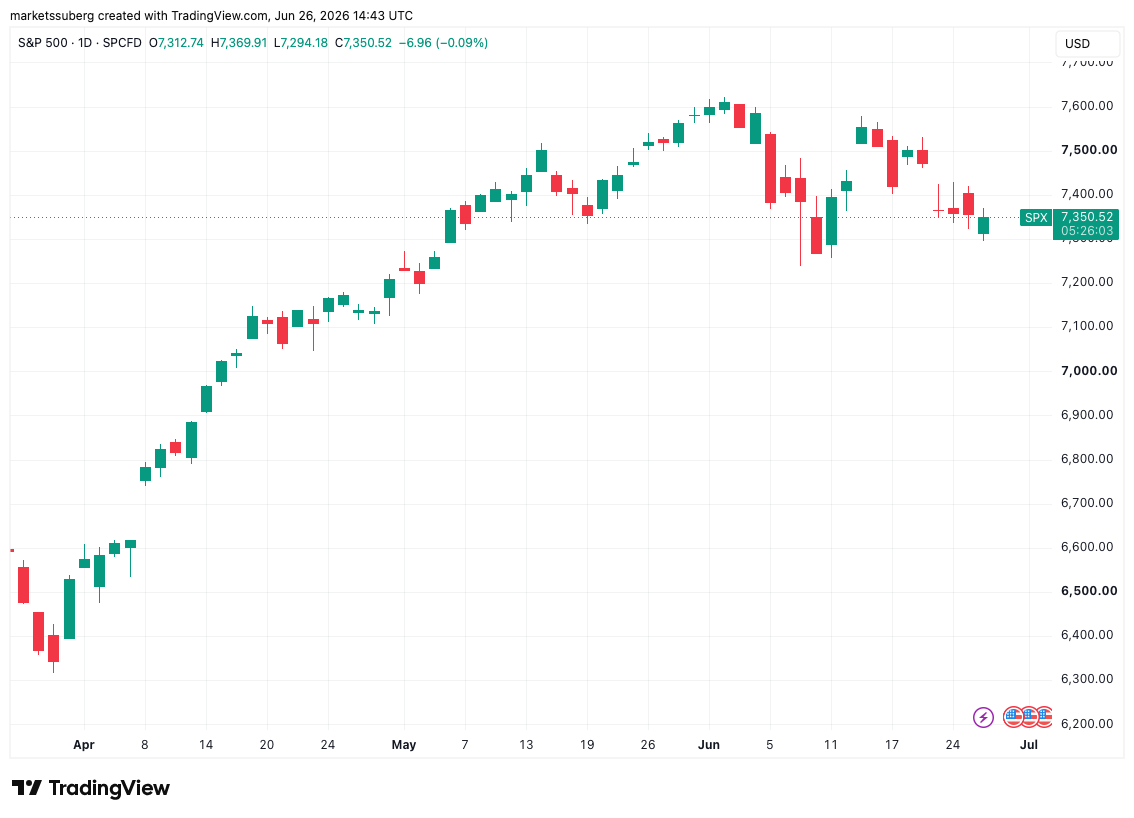
S&P 500 one-day chart. Source: Cointelegraph/TradingView
Surrounding the weakness, tech-stock performance remained a popular talking point. Earlier, Micron Technologies boosted the mood with stronger-than-expected earnings data.
Trading resource The Kobeissi Letter suggested that a broader bullish turnaround could already be due.
“Most people do not realize how many tech giants are already deep bear market territory,” it wrote in a post on X.
Kobeissi noted that many major tech companies were already down more than 50% versus their all-time highs, with crypto exchange Coinbase leading at -69%.
“The S&P 500 won’t tell you this,” it added.
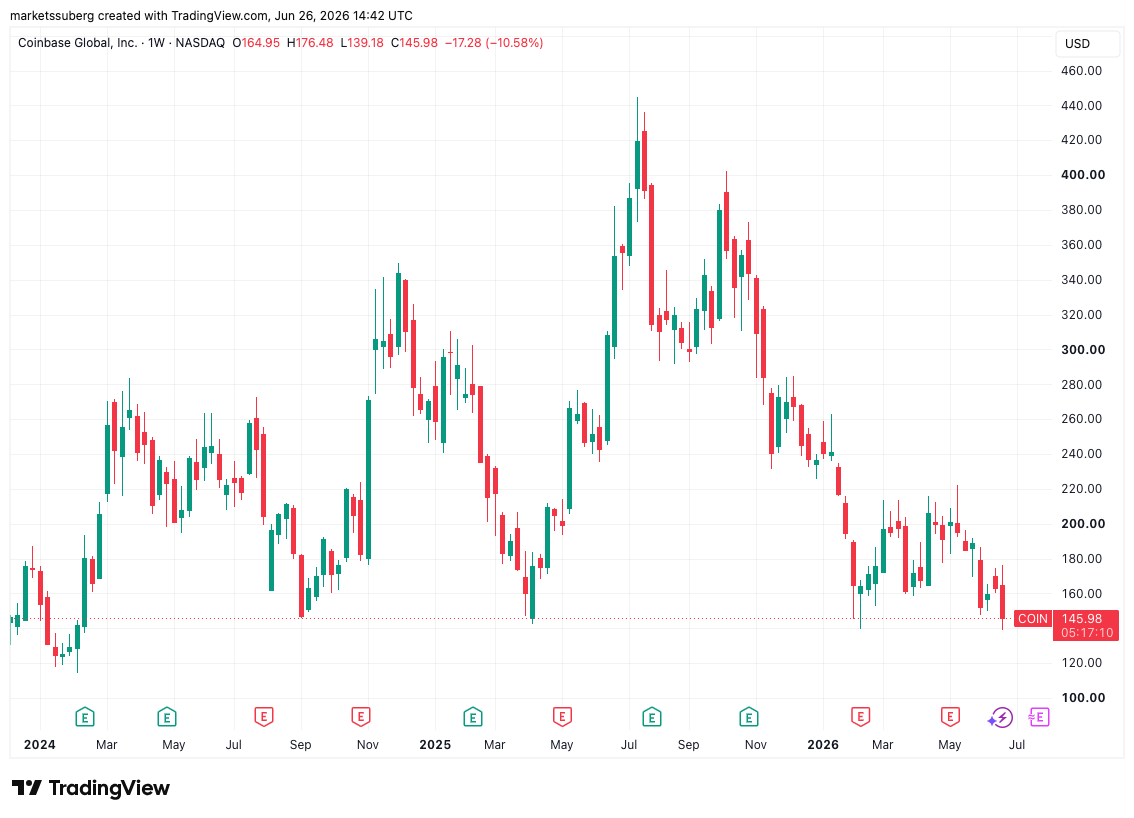
Coinbase stock one-week chart. Source: Cointelegraph/TradingView
In its latest analysis, trading company QCP Capital stressed the influence of US inflation trends on risk assets going forward.
As Cointelegraph reported, the May print of the Personal Consumption Expenditures (PCE) index, known as the Federal Reserve’s “preferred” inflation gauge, recorded its highest year-on-year increase since mid-2023.
“Core PCE is nowcast at 3.30%, while headline PCE is nowcast at 3.82%, both still above target,” QCP wrote.
“The Fed’s 2026 inflation forecast has also moved up to 3.6%, from 2.7%, reinforcing the view that inflation, rather than growth, remains the binding constraint.”
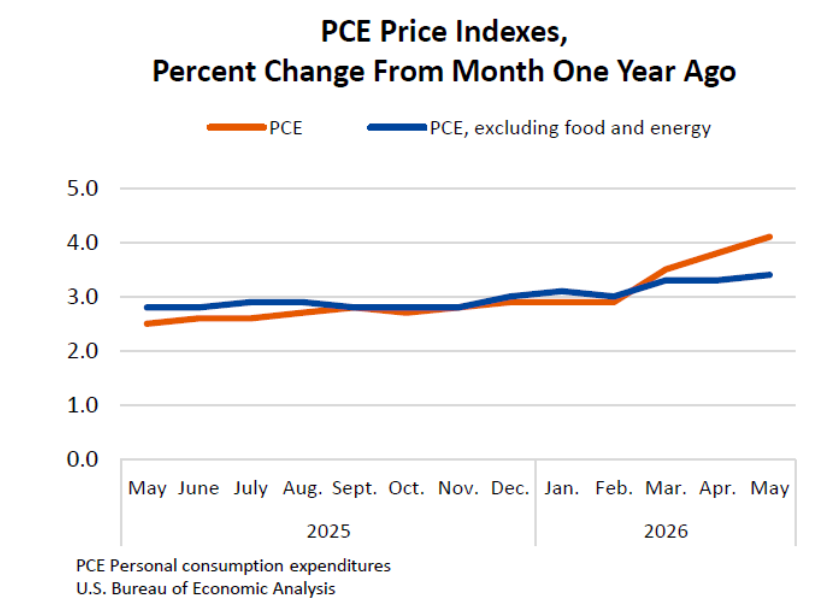
US PCE Index one-month % change (screenshot). Source: Bureau of Economic Analysis
BTC price 200-week trend line reclaim in focus
Looking at the short term, crypto trader and analyst Michaël Van de Poppe asked whether BTC price action would continue its downward trend.
Related: BTC price four-year trend calls for $76K as analysis says Bitcoin ‘not broken’
“It’s an interesting day for Bitcoin,” he told X followers, noting the upcoming quarterly options expiry event.
Van de Poppe drew attention to the performance of Strategy, the company with the world’s largest Bitcoin treasury, and its Bitcoin funding vehicle, Stretch (STRC).
“In all honesty, the fact that STRC has seen a relatively big drop yesterday and Bitcoin essentially stalled at $60,000 is not a weak signal. Other than that, there’s a bullish divergence on the daily timeframe, which is still far from confirmed,” he continued.
“It can signal that we’re bouncing back upwards, and, yes, the markets need to bounce back upwards in order to close above the 200-Week MA.”
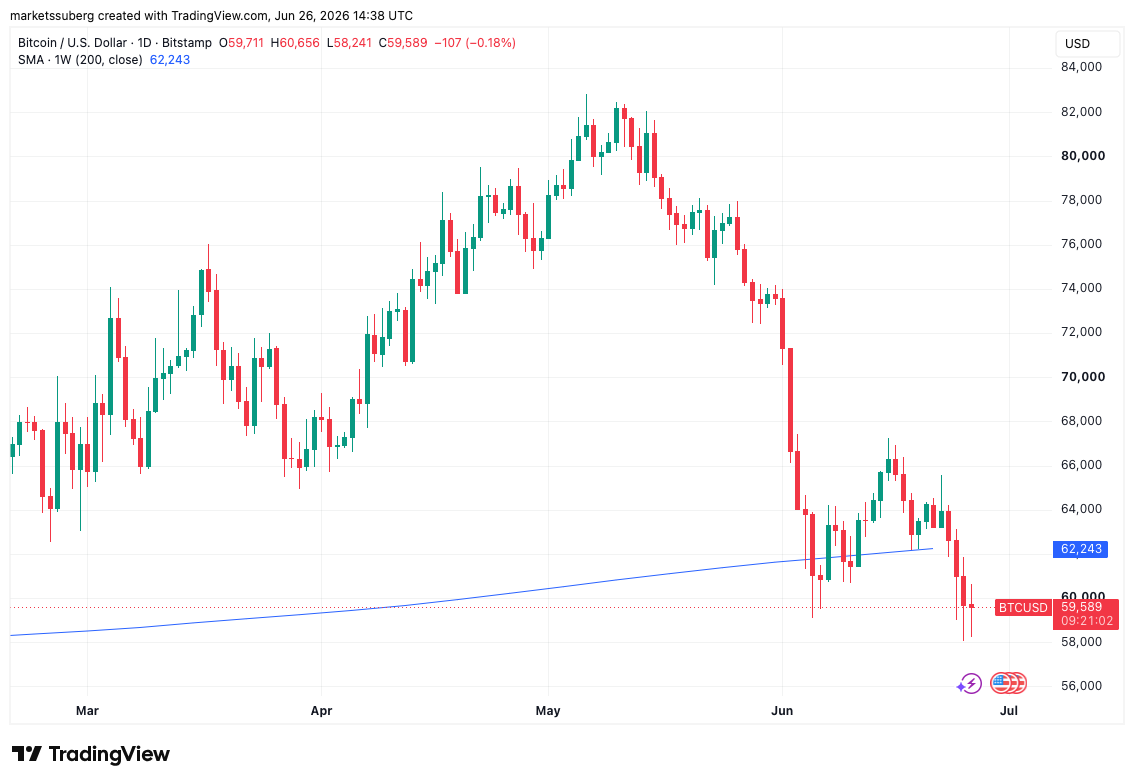
BTC/USD one-day chart with 200-week SMA. Source: Cointelegraph/TradingView
The trend line in question, the 200-week simple moving average (SMA), stood at $62,243 at the time of writing.