



Crypto analyst Merlijn The Trader has published a detailed Bitcoin chart analysis, pointing to a rare monthly Moving Average Convergence Divergence (MACD) setup that has preceded major bull runs in BTC’s history. According to the analyst, Bitcoin is showing signs of repeating the same MACD, signaling a potential bullish turnaround ahead. He noted that the cryptocurrency’s bottom is not yet in, expecting another major price decline before an explosion to a new all-time high.
Bitcoin Historical Cycle Patterns Signal Ongoing Reset Phase
In an X post, Merlijn The Trader urged investors and traders to pay close attention to Bitcoin’s monthly MACD, which is currently emerging on its price chart. Despite past appearances leading to a parabolic surge, the analyst believes this MACD may not trigger an instant pump but could shift momentum, gradually driving a sustained price rally.

According to Merlijn The Trader, Bitcoin is in a momentum reset phase that has occurred three times in its history, and a massive bull run followed each previous instance. The analyst shared a chart, divided by four vertical green lines at 2015, 2019, 2023, and 2026. Each of these lines represents areas where bearish momentum peaked and began exhausting itself.
Additionally, the analyst marked several triangle formations in each cycle, in which the price made lower highs while support held, leading to a breakout. In every past cycle highlighted on the chart, a breakout from this symmetrical triangle pattern led to an explosive upside that took Bitcoin’s price to new highs.
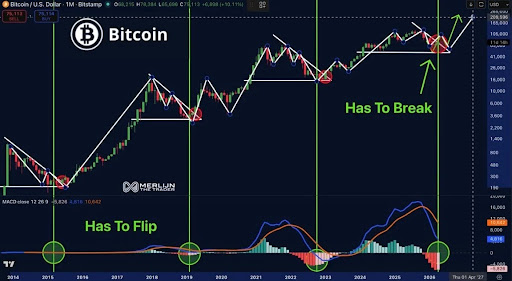
For instance, during the 2023 cycle, Bitcoin declined to below $20,000 as its price remained compressed within the triangle pattern. However, after a breakout, it skyrocketed above $100,000 in 2025, underscoring a sustained, gradual rally. The same trend is seen during the 2015 and 2019 cycles, with a triangle breakout determining Bitcoin’s upside move.
The monthly MACD plays a key role in this historical pattern, as the indicator had flipped into positive territory before each bull rally. At the time, Bitcoin’s MACD had moved from deep red into a light pink territory halfway through the price bottom. Merlijn The Trader noted that this single change was a key signal of an upcoming Bitcoin bull run.
BTC’s Current MACD And ATH Outlook
For this current cycle, Merlijn The Trader argues that Bitcoin has not yet reached its true market bottom. He noted that the price action is closely mirroring the patterns from 2015, 2019, and 2023. The cryptocurrency has already developed a similar long-term triangle pattern on its chart, where price has been compressing and trending lower for months.
Based on historical behavior, Bitcoin typically forms a complete bottom after the monthly MACD flips pink. Merlijn The Trader has confirmed that the indicator has already flipped pink, suggesting it’s only a matter of time before BTC reaches a final price floor.
Once this bottoming phase is complete, the analyst believes BTC could begin its highly anticipated bull run. However, he stresses that this move would likely only begin after the cryptocurrency breaks out of its bearish triangle structure. If this scenario plays out, his chart projection points to a potential all-time high rally toward $209,596 by 2027, with a possible extended move reaching as high as $283,500.
Featured image from Pngtree, chart from Tradingview.com

Editorial Process for bitcoinist is centered on delivering thoroughly researched, accurate, and unbiased content. We uphold strict sourcing standards, and each page undergoes diligent review by our team of top technology experts and seasoned editors. This process ensures the integrity, relevance, and value of our content for our readers.