



Bitcoin (BTC) is showing strong signs that its latest long-term floor is already in, according to a classic trading indicator.
Key points:
- In August, the Fisher Transform indicator delivered a monthly bullish crossover for only the fourth time in Bitcoin’s history, according to Willy Woo.
- Previous monthly crossovers accompanied the end of Bitcoin bear markets, including in late 2022, when the Fisher Transform Indicator hit -3.83.
- A bullish divergence continued on weekly time frames, echoing the closing stages of the 2022 BTC price downtrend.
Analyst sees evidence of clean BTC price reversal
In an X thread on Friday, analyst Willy Woo flagged key readings from the Fisher Transform indicator, a price trend analysis tool created in 2002.
The indicator smooths an asset’s price action to create a readable trend-strength chart. Market prices tend to spend more time around extreme values than ordinary statistical data. The Fisher transform corrects this by applying a log-based transform.

The indicator is formed of two trend lines, the Fisher line and the trigger line, that fluctuate on a scale with zero at its center. The trigger line is derived from the Fisher line, plotted with a delay of one period.
Woo shows that for Bitcoin, a sharp upward reversal in Fisher, where its two trend lines cross over one another, has corresponded to bear-market bottoms when viewed on monthly time frames.
“BTC bottoms: 3 for 3 without fake out. Latest cross is the 4th on record,” he commented.
BTC/USD one-month chart with Fisher Transform data. Source: Cointelegraph/TradingView
The cross in question occurred during July at -2.26, and if it continues to play out, history suggests that BTC/USD will embark on a new macro uptrend. Woo, however, notes that price could still consolidate and continue lower, referencing a corresponding phenomenon during bull markets where Fisher delivered a bearish crossover, only to offer a fresh bullish one later.
This, he argues, is due to the presence of speculative traders during long-term BTC price uptrends, who influence market momentum because they are sensitive to short-term price moves. By contrast, during bear-market bottom phases, such traders are mostly absent, boosting the reliability of Fisher bottom signals.
“When price falls to a point where investors find value, buy-pressure fires back up but we are devoid of speculators. Price reverses more cleanly without the choppy fake outs seen in tops. Hence bottoms are easier to define. This is seen in many signals, also seen in the Fisher Transform here,” he added.
Fisher bullish divergence tracks 2022 bear market
The weekly chart shows another Fisher bull structure in process throughout 2026. Here, the indicator hit its swing low of -2.85 at the end of December last year, with BTC/USD still at around $90,000.
Related: Bitcoin treasuries buy just 5.9K BTC in three months as paper losses linger
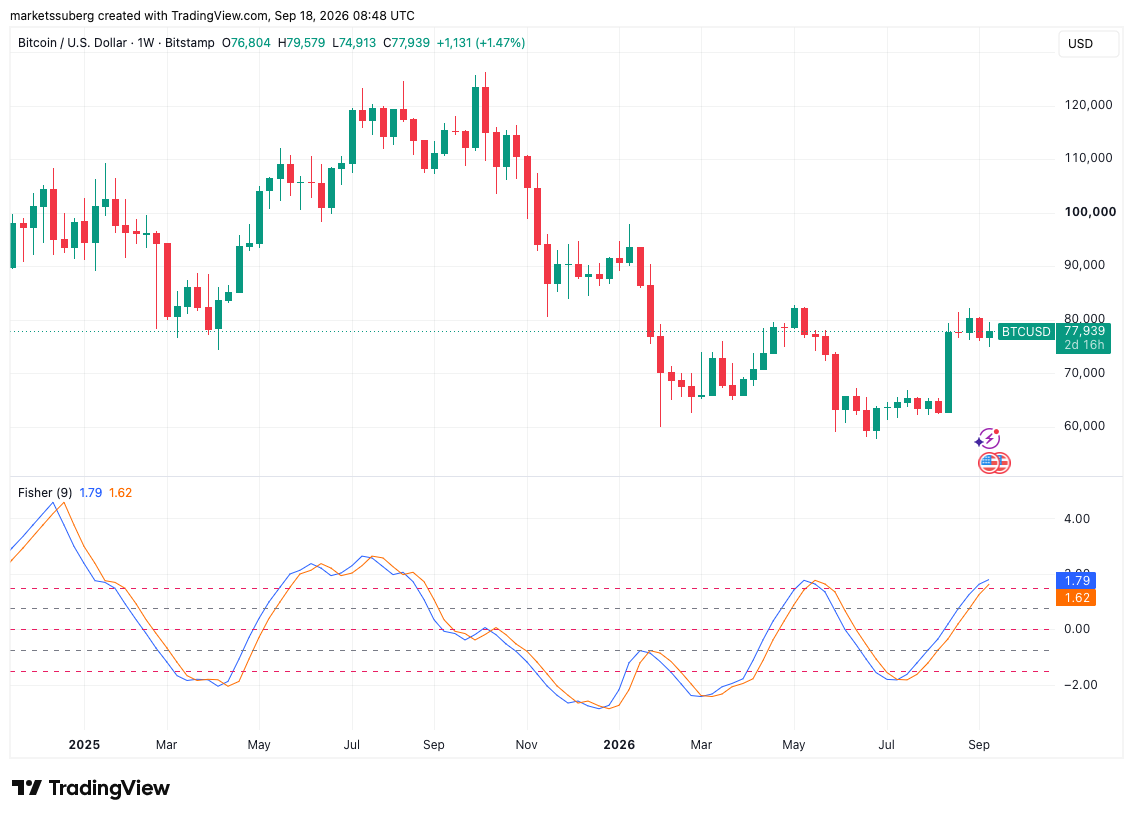
BTC/USD one-week chart with Fisher Transform data. Source: Cointelegraph/TradingView
Since then, Fisher has delivered a succession of higher lows while price itself sees lower lows, creating a bullish divergence. The same pattern emerged in 2022, with a bullish divergence in Fisher accompanying the final six months of Bitcoin’s previous bear market.
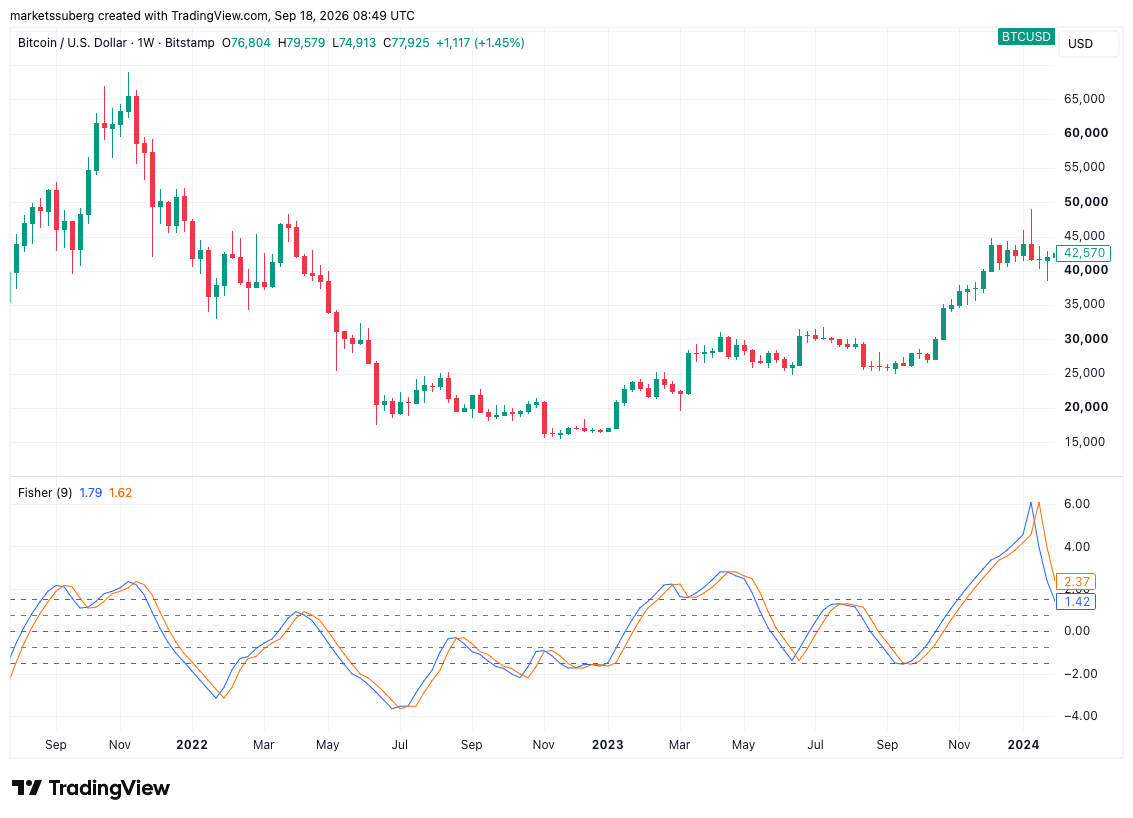
BTC/USD one-week chart with Fisher Transform data. Source: Cointelegraph/TradingView
Despite various onchain metrics triggering bear-market reversal signals in recent months, doubts remain over whether Bitcoin’s 21-month lows near $57,000 on July 1 really marked a new cycle bottom.
Last week, Woo himself noted a lack of typical buyer interest at these lows, with bid-side activity suggesting that only a handful of large-volume investors were accumulating at the time.